


Databricks pricing decoded for finance and platform owners
NOV. 3, 2026
6 Min Read
Databricks costs become predictable when you model consumption by workload before you migrate, because the bill follows usage and usage follows design choices you can see in advance.
Finance teams used to fixed licenses find usage pricing hard to forecast, and they aren't alone. Managing cloud spend remains a top challenge for 85% of organizations in Flexera's 2026 State of the Cloud survey, and wasted spend rose to 29%.
The fix is a consumption model that maps each workload to its compute type, schedule and size, so your budget owners see the cost curve before the first job runs.
Key Takeaways
- 1. Databricks bills compute in DBUs per second, with rates that vary by compute type, cloud, region and plan tier, plus cloud infrastructure on classic compute.
- 2. Design defaults such as idle time, cluster size, schedule frequency and interactive compute for production jobs move the bill more than the list price.
- 3. Modeling consumption by workload before migration and reviewing tagged actuals monthly turns usage pricing into a forecast finance can defend.
How Databricks pricing works in plain terms
Databricks charges for the compute your workloads use, measured in Databricks Units, or DBUs, and billed per second. Each type of compute has its own DBU rate. On classic compute, you also pay your cloud provider for the virtual machines underneath, while serverless options bundle that infrastructure into the Databricks rate.
Your monthly bill has two or three lines. A nightly data pipeline on classic jobs compute shows up as DBUs on the Databricks invoice and as virtual machine hours on the AWS, Microsoft Azure or Google Cloud invoice. Storage sits with the cloud provider too, in object storage you already own.
That split matters for finance. You'll need both invoices to see the real cost of a workload, and you'll want them tagged the same way so they can be matched line by line.
What a DBU measures and why rates differ
A DBU is a normalized unit of processing capacity per hour. The number of DBUs a cluster consumes depends on its size and instance type, and the price per DBU depends on the compute type, cloud, region and plan tier. The same hour of work can cost very different amounts.
A scheduled transformation job running on jobs compute carries a lower DBU rate than the same code run interactively on all-purpose compute. SQL warehouses, model serving and serverless options each carry their own rates again. Teams that build pipelines in notebooks and never move them to jobs compute pay the interactive rate for production work.
The rate card rewards matching each workload to the right compute type. That's a design decision, and it's one finance can ask about directly.
Plan tier and contract terms shift the rate again. Premium and Enterprise tiers add governance and security features at a higher DBU price, and committed-use agreements trade a spending commitment for a discount. Neither choice changes how much compute your jobs use, so model usage first and negotiate the rate second.
The workload choices that drive Databricks spend
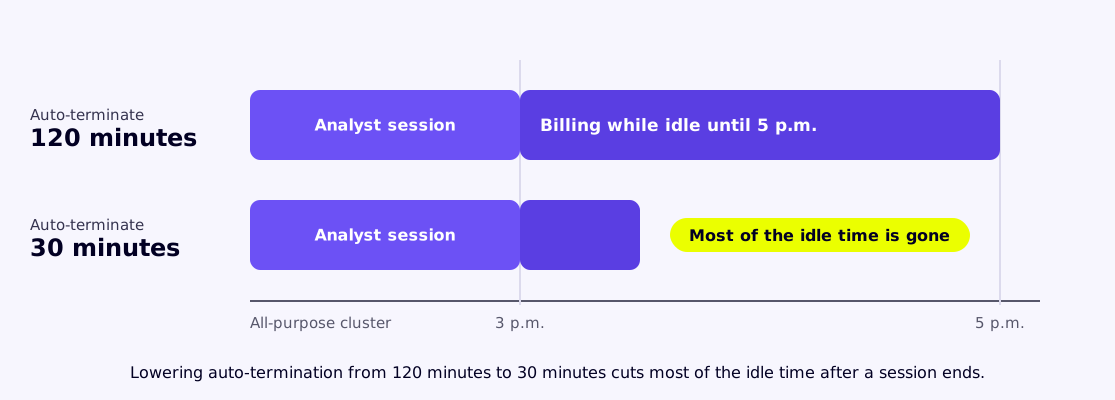
Databricks spend depends on how much compute runs, how long it runs and which type it runs on. Cluster size, idle time, schedule frequency and the choice between classic and serverless move the bill far more than the list price does. Most overspend traces back to a handful of design defaults.
Idle time is the easiest to see. A team sets an all-purpose cluster to auto-terminate after 120 minutes so analysts don't wait for restarts. Each analyst session that ends at 3 p.m. leaves the cluster billing until 5 p.m. Lowering auto-termination to 30 minutes cuts most of that idle time, and analysts wait a few minutes once or twice a day.
"Neither choice changes how much compute your jobs use, so model usage first and negotiate the rate second."
These choices also pull in different directions.
- Larger clusters finish jobs sooner but cost more per hour
- Frequent schedules keep data fresh but multiply compute hours
- Serverless removes idle infrastructure but carries a higher DBU rate
- Interactive compute speeds development but costs more for production jobs
- Photon acceleration raises the DBU rate but can shorten run times
How to estimate Databricks costs before you migrate
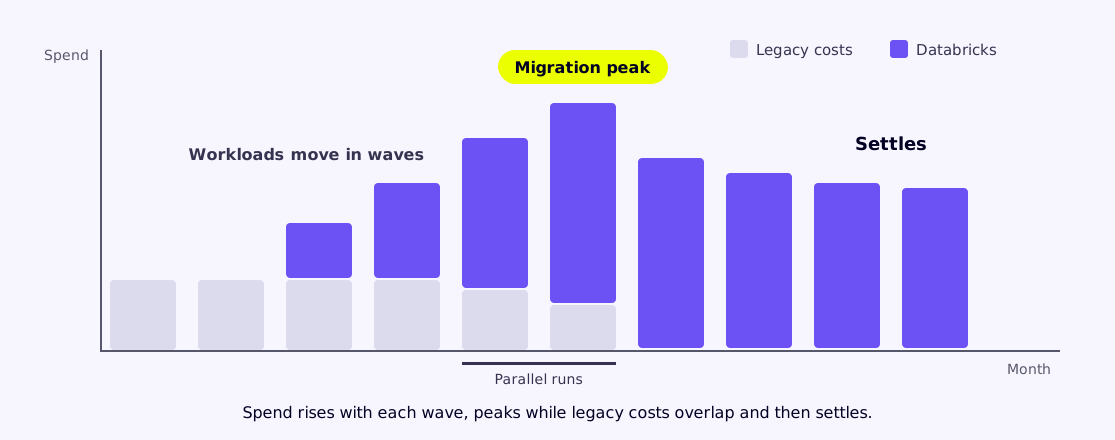
You estimate Databricks costs by inventorying the workloads you plan to move, assigning each one a compute type, size and schedule, and multiplying the expected run time by the DBU rate. Add cloud infrastructure for classic compute and storage. The result is a cost curve by month that shows how spend moves as workloads arrive.
Lumenalta®models consumption this way before a migration, working with platform owners and finance to profile each workload on the current system first. A nightly load that runs 90 minutes on the legacy warehouse gets a sized jobs cluster and a schedule, and the model carries a range for its run time. Ad hoc analysis gets a SQL warehouse with auto stop.
The curve matters more than the total. Spend rises as workloads move in waves, overlaps with legacy costs during parallel runs, and then settles. Budget owners who see that shape upfront won't read the migration peak as a cost overrun.
Using the Databricks pricing calculator without false precision
The Databricks pricing calculator turns your assumptions about compute type, instance size, hours and region into an estimated cost. It's useful for comparing scenarios, but it can only be as accurate as the run times you feed it. Treat its output as a range tied to your workload profile.
"Budget owners who see that shape upfront won't read the migration peak as a cost overrun."
A platform owner might enter a medium jobs cluster running four hours a night for 30 nights. The calculator returns a DBU cost for that scenario. Change the run time to six hours, because the legacy job sometimes runs long, and you see the range finance should budget against.
| Calculator input | Where the real number comes from |
|---|---|
| Compute type | The workload's purpose, such as scheduled pipelines on jobs compute or dashboards on a SQL warehouse |
| Instance size and count | Data volume and the run time the business needs, tested on a pilot run |
| Hours per month | Measured run times on the current platform, adjusted for the new design |
| Region and cloud | Where your data already lives and any residency rules you follow |
| Plan tier and discounts | Your contract terms, including any committed-use pricing you negotiate |
How to forecast Databricks consumption after go-live
Forecasting Databricks consumption after go-live means tracking actual DBU use by workload and owner, comparing it with the pre-migration model and updating the forecast each month. Tags and system tables give you that view. The forecast improves as real usage replaces assumptions.
Ownership is what makes this work. Cost data needs context to be useful, just as AI does. Spend you can't tie to an owner, a product and a cost center can't be forecast, so tag every cluster and warehouse in Unity Catalog with those three fields from day one.
The discipline is spreading fast, and 98% of FinOps practitioners now manage AI spend, up from 31% two years earlier, according to the FinOps Foundation. Databricks workloads belong in the same monthly review.
Budget confidence comes from knowing your workloads
Databricks pricing rewards teams that know their workloads. When every job has an owner, a compute type and a measured run time, the bill stops being a surprise and becomes a forecast you can defend. That confidence comes from modeling consumption before migration and reviewing it every month after.
The first forecast will be wrong in places, and that's expected. What matters is that each monthly review narrows the gap between modeled and actual use, so by the third quarter the forecast is close enough to plan headcount and new use cases against. Finance and platform owners get there faster when they build the model with each other from the start. Lumenalta®'s teams of senior specialists and agents do that work shoulder to shoulder with both groups, so the cost curve is agreed before the first workload moves.
Table of contents
- How Databricks pricing works in plain terms
- What a DBU measures and why rates differ
- The workload choices that drive Databricks spend
- How to estimate Databricks costs before you migrate
- Using the Databricks pricing calculator without false precision
- How to forecast Databricks consumption after go-live
- Budget confidence comes from knowing your workloads
See how workload-based Databricks cost modeling lowers cost and improves data agility.